 Thrum
How to check CPU usage on a Mac
Last checked: October 2026 on macOS 26 Tahoe.
To check CPU usage on a Mac, open Activity Monitor (Applications > Utilities), click the CPU tab, and click the % CPU column so the busiest process is at the top. The bottom of the window shows how much of the CPU is used by the system, by apps (User) and how much is idle, with a CPU Load graph. In Terminal, top -o cpu shows the same list.
Check CPU usage in Activity Monitor
- Open Activity Monitor. Press Command-Space, type Activity Monitor and press Return, or open it from Applications > Utilities.
- Click CPU at the top of the window.
- Click the % CPU column header. Click it again if the smallest values are on top.
- Choose View > All Processes so processes owned by macOS and other users are included, not only your own.
- To make the numbers update faster, choose View > Update Frequency > Very often (1 sec).
These steps are the same in macOS 26 Tahoe, macOS 15 Sequoia and macOS 14 Sonoma.
What the numbers mean
- % CPU is counted per core. 100% means one core is fully busy, so a process can show 200%, 400% or more on a Mac with several cores.
- System, User and Idle at the bottom of the window add up to 100% of the whole CPU. User is work done by apps, System is work done by macOS for them, and Idle is what is left over.
- CPU Time is how much CPU a process has used since it started. A process with a large CPU Time that you rarely use is worth a look.
- Threads and Idle Wake Ups show how much a process is doing in the background. Many wake-ups keep the CPU from resting, which costs battery on a laptop.
Short spikes to high values are normal when you open an app, export a file or load a web page. A process that stays near the top with a high % CPU for minutes, while you are not asking it to do anything, is usually the one slowing the Mac down or making the fans spin.
Keep a CPU graph on screen
Activity Monitor has three smaller views for the total CPU load:
- Window > CPU Usage (Command-2): a small window with a bar per core.
- Window > CPU History (Command-3): a scrolling graph per core.
- View > Dock Icon > Show CPU History or Show CPU Usage: the Activity Monitor icon in the Dock becomes a live graph.
All three show the total only, not which app is responsible, and they need Activity Monitor to keep running. macOS has no CPU meter for the menu bar; see how to see CPU usage in the Mac menu bar.
Check CPU usage in Terminal
Open Terminal (Applications > Utilities) and run:
top -o cpuThis lists processes sorted by CPU and updates every second. The header line CPU usage shows user, sys and idle for the whole Mac. Press q to quit. For a one-time list of the ten busiest processes:
ps -Ao pid,%cpu,comm -r | head -n 11-r sorts by CPU. Like Activity Monitor, both commands count 100% per core.
When a process stays busy
Select it in Activity Monitor and click the Stop button (the X in the toolbar), then choose Quit. Use Force Quit only if Quit does not work; unsaved changes in that app are lost. See how to force quit an app on a Mac. If the busy process is kernel_task or WindowServer, quitting is not possible; see kernel_task and WindowServer.
CPU usage in the menu bar with Thrum
Thrum keeps a live CPU graph in the menu bar, so you can see the load without opening Activity Monitor. Click it and the CPU tab shows a 60-second graph with system, user and idle CPU, GPU use for the whole Mac, and the eight processes using the most CPU with their app icons, including processes owned by root and other users.
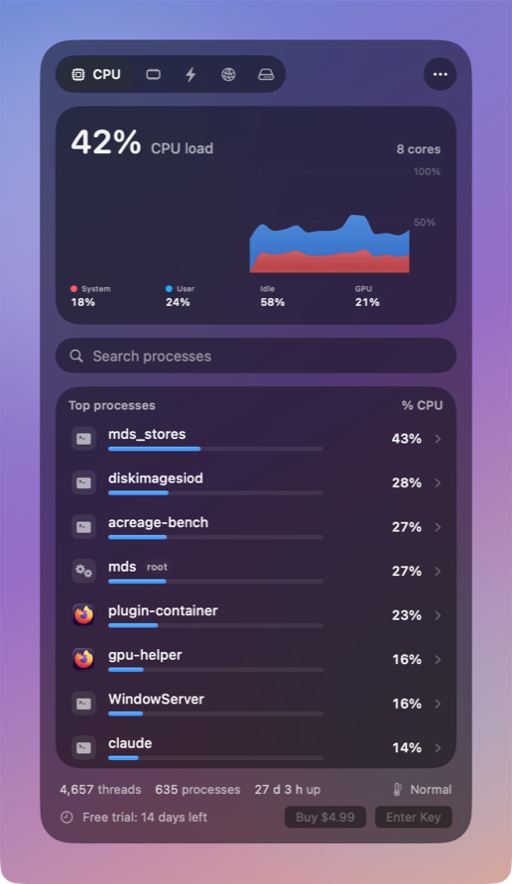
- The menu bar item can show a CPU graph, CPU percentage, memory used, or CPU and memory bars.
- Click a process for its PID, user, threads, CPU time, idle wake-ups and memory, and Quit or Force Quit it after a confirmation.
- An optional alert tells you when an app stays above a CPU threshold for a few minutes. Alerts are off until you turn them on.
- Thrum uses the same per-core scale as Activity Monitor, and has an Open in Activity Monitor button for the full list.
Thrum is $4.99 once, with a 14-day free trial and no account. After the trial the menu bar graph and the popover keep working; Quit, Force Quit and alerts need a license. It requires macOS 26 Tahoe, on Apple silicon or Intel.
Questions
Why does a process show more than 100% CPU?
Activity Monitor counts 100% per CPU core. A process keeping four cores busy shows 400%. The System, User and Idle figures at the bottom are percentages of the whole CPU instead.
Is high CPU usage bad for a Mac?
Not for short periods. Long stretches of high CPU make a Mac warmer, can make the fans spin and use more battery. If a process stays busy while you are not using it, quit it.
How do I see CPU usage per core?
In Activity Monitor, choose Window > CPU History (Command-3) for a graph per core, or Window > CPU Usage (Command-2) for a bar per core.