 Thrum
How to find what is slowing down your Mac
Last checked: October 2026 on macOS 26 Tahoe.
When a Mac feels slow, the cause is usually one of four things: a process using a lot of CPU, too little free memory, a process keeping the disk busy, or heat. Activity Monitor, in Applications > Utilities, can show all four. This page goes through them in the order worth checking.
1. CPU: is one app working hard?
- Open Activity Monitor and click the CPU tab.
- Click the % CPU column so the highest value is at the top.
- Choose View > All Processes so system processes are included.
A value of 100% means one core is fully busy, so 300% is three cores. Short spikes are normal; a process that stays high for minutes while you aren't using it is worth stopping. At the bottom of the tab, System, User and Idle show how busy the whole Mac is.
2. Memory: is the Mac short of memory?
- Click the Memory tab.
- Look at the Memory Pressure graph at the bottom. Green is fine. Yellow means macOS is compressing memory. Red means it is swapping to disk, which is when a Mac slows down.
- Sort by Memory to see which apps use the most. Browsers with many tabs are a common cause.
A high Memory Used figure on its own is not a problem: macOS fills spare memory with cached files and gives it back when apps need it. Swap Used tells you how much has gone to disk.
3. Energy: what is busy in the background?
Click the Energy tab and sort by Energy Impact. This shows which apps are working hardest, including ones in the background, and on a laptop it is a good guide to what drains the battery. The 12 hr Power column shows which apps have been heavy over time.
4. Disk and heat
Click the Disk tab and sort by Bytes Written or Bytes Read to find a process keeping the disk busy, such as a backup, a sync client or Spotlight indexing after an update. If kernel_task sits near the top of the CPU tab, macOS is usually holding the CPU back to keep the Mac cool; quit other busy apps and check that the vents are clear.
Stopping a process
- In Activity Monitor, select the process, click the Stop button (the X in the toolbar), and choose Quit. Choose Force Quit only if Quit doesn't work.
- For apps, Apple menu > Force Quit (Option-Command-Escape) lists open apps and stops the one you choose.
- Unsaved changes are lost with Force Quit.
Limits of Activity Monitor
Each question needs a different tab, the window has to be open to see anything, and it doesn't warn you when something stays busy. It is still the most complete view, and the one to use when you need every process.
All four in the menu bar with Thrum
Thrum keeps a live CPU graph in the menu bar. One click opens a popover with CPU, Memory, Energy, Network and Disk tabs, each with a 60-second graph and the eight processes using the most. The Memory tab shows memory pressure, app, wired, compressed and cached memory, and swap. Click a process for its PID, user, threads, CPU time, idle wake-ups and memory, and to Quit or Force Quit it after a confirmation.
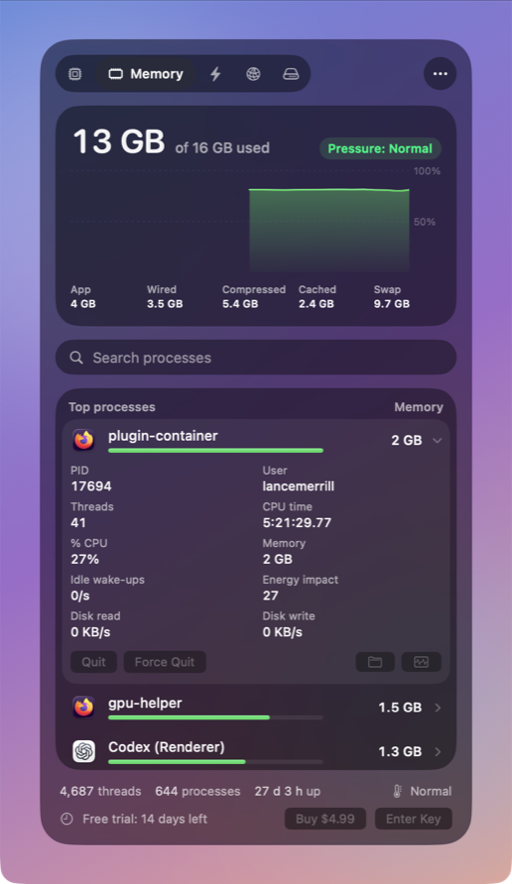
- Energy impact per app, battery level and time remaining on the Energy tab.
- Upload and download speed per app, and disk read and write per app.
- Threads, processes, uptime and thermal state in the footer.
- Optional alerts when an app stays busy, or memory pressure gets high.
- Open in Activity Monitor and Reveal in Finder next to each process.
Thrum is $4.99 once, with a 14-day free trial and no account. After the trial the menu bar graph and the popover keep working; Quit, Force Quit and alerts need a license. It requires macOS 26 Tahoe, on Apple silicon or Intel.
Questions
What is kernel_task and why is it using so much CPU?
kernel_task is macOS itself. A high value often means macOS is limiting the CPU to keep the Mac cool. Quitting other busy apps and giving the Mac better airflow usually brings it down.
Is high memory use a problem?
Not by itself. macOS keeps memory full of cached files on purpose. Memory pressure is the number to watch: green is fine, yellow and red mean the Mac is short of memory.
What is the difference between Quit and Force Quit?
Quit asks the app to close, so it can save work. Force Quit stops it at once, and unsaved changes are lost.